Problem
Sometimes, web applications run smoothly during development and testing, but mysterious issues only surface in the production environment. Debugging these production problems can be challenging, especially when you don’t have direct access to the server. For example, when deploying on a traditional VM, it’s straightforward for developers to capture memory dumps for in-depth analysis. But what happens when your application is hosted on a PaaS solution like Azure App Service, where you can’t access the underlying VM? Let's check out.
Solution
Option 1: Using Diagnostic Tools
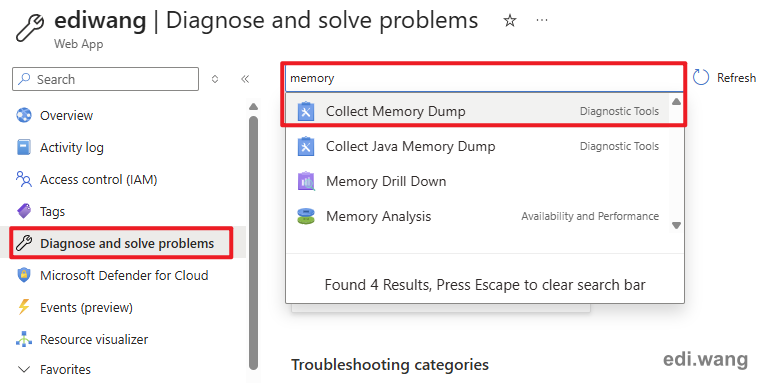
This is a very popular way to get memory dump on Azure App Service. Just go to "Diagnose and solve problems" menu and search for "memory", you will get the "Collect Memory Dump" menu.
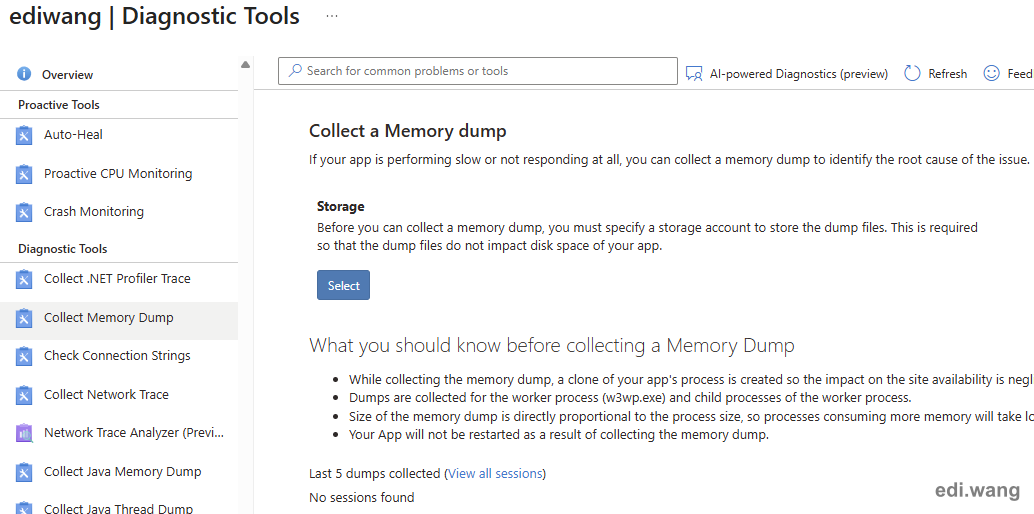
Then, you will be asked to have an Azure Storage Account ready to save the dump file.
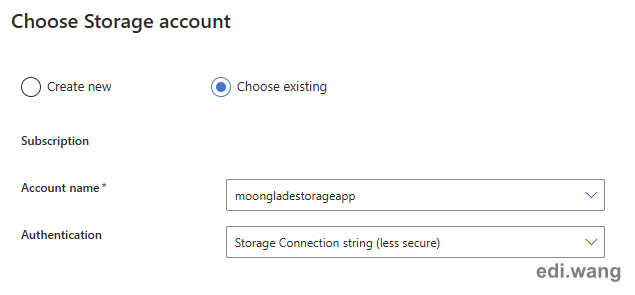
You can either create a new storage account or using an existing one.
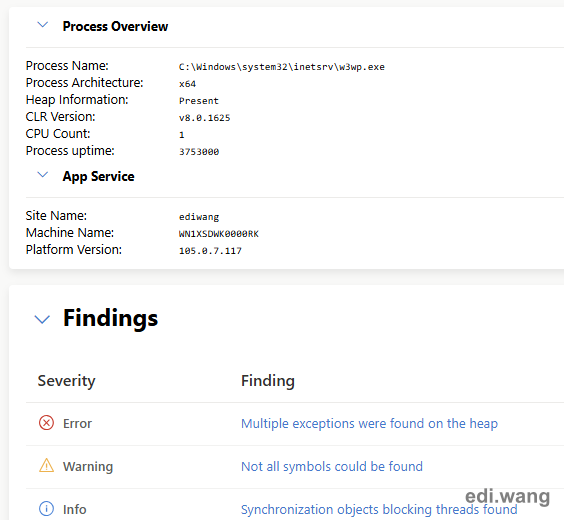
Now, the diagnostic tool is ready to help you collect and analyze the memory dump.
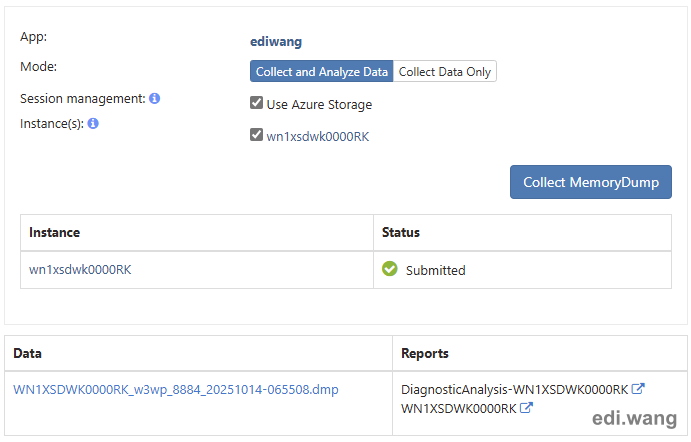
You can get the dump file and view the report.
Option 2: Using Advanced Tools (Kudu)
Kudu is a very old tool that were there in App Service for over a decade, it is old, but not obsolete.

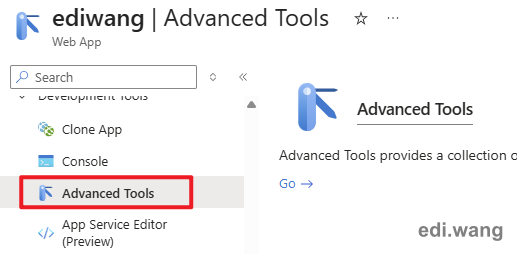
To use Kudu, open the Advanced Tools menu.
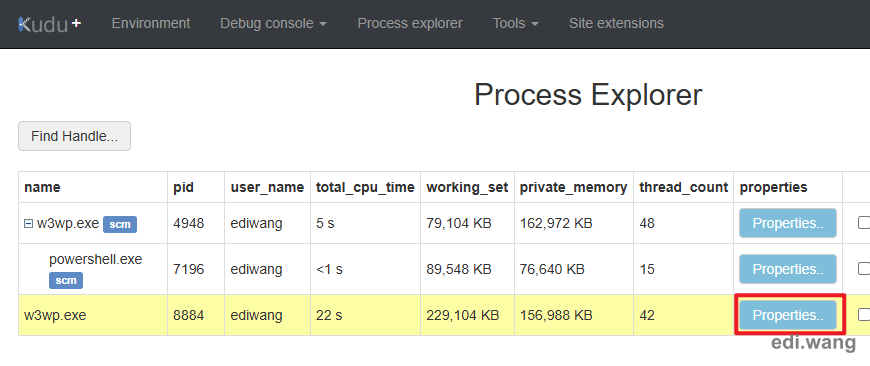
Go to Process explorer menu, and find the w3wp.exe process that does not have a scm tag. Open it's properties.
Scroll down to the bottom of the dialog and click "Download memory dump"
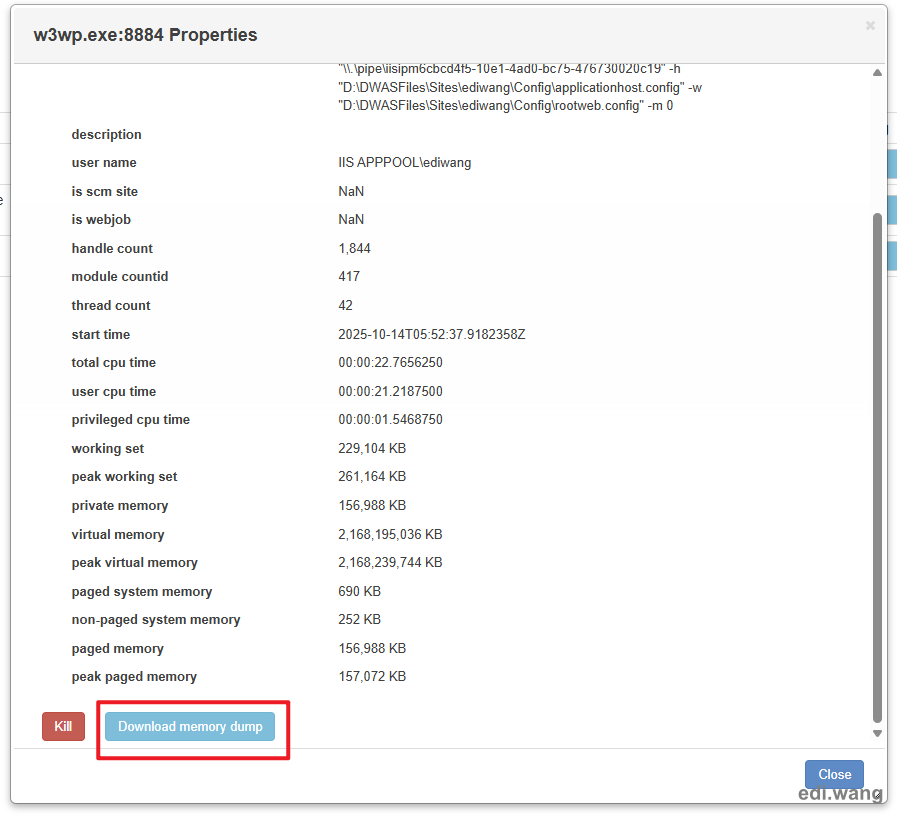
You may need to wait for a while, and the dump file will be downloaded within your browser.
This method does not give you an automatic report of what's going on with your app. You need to work 996 to find out the issue yourself.
Comments